The CARMA-NRO Orion Survey
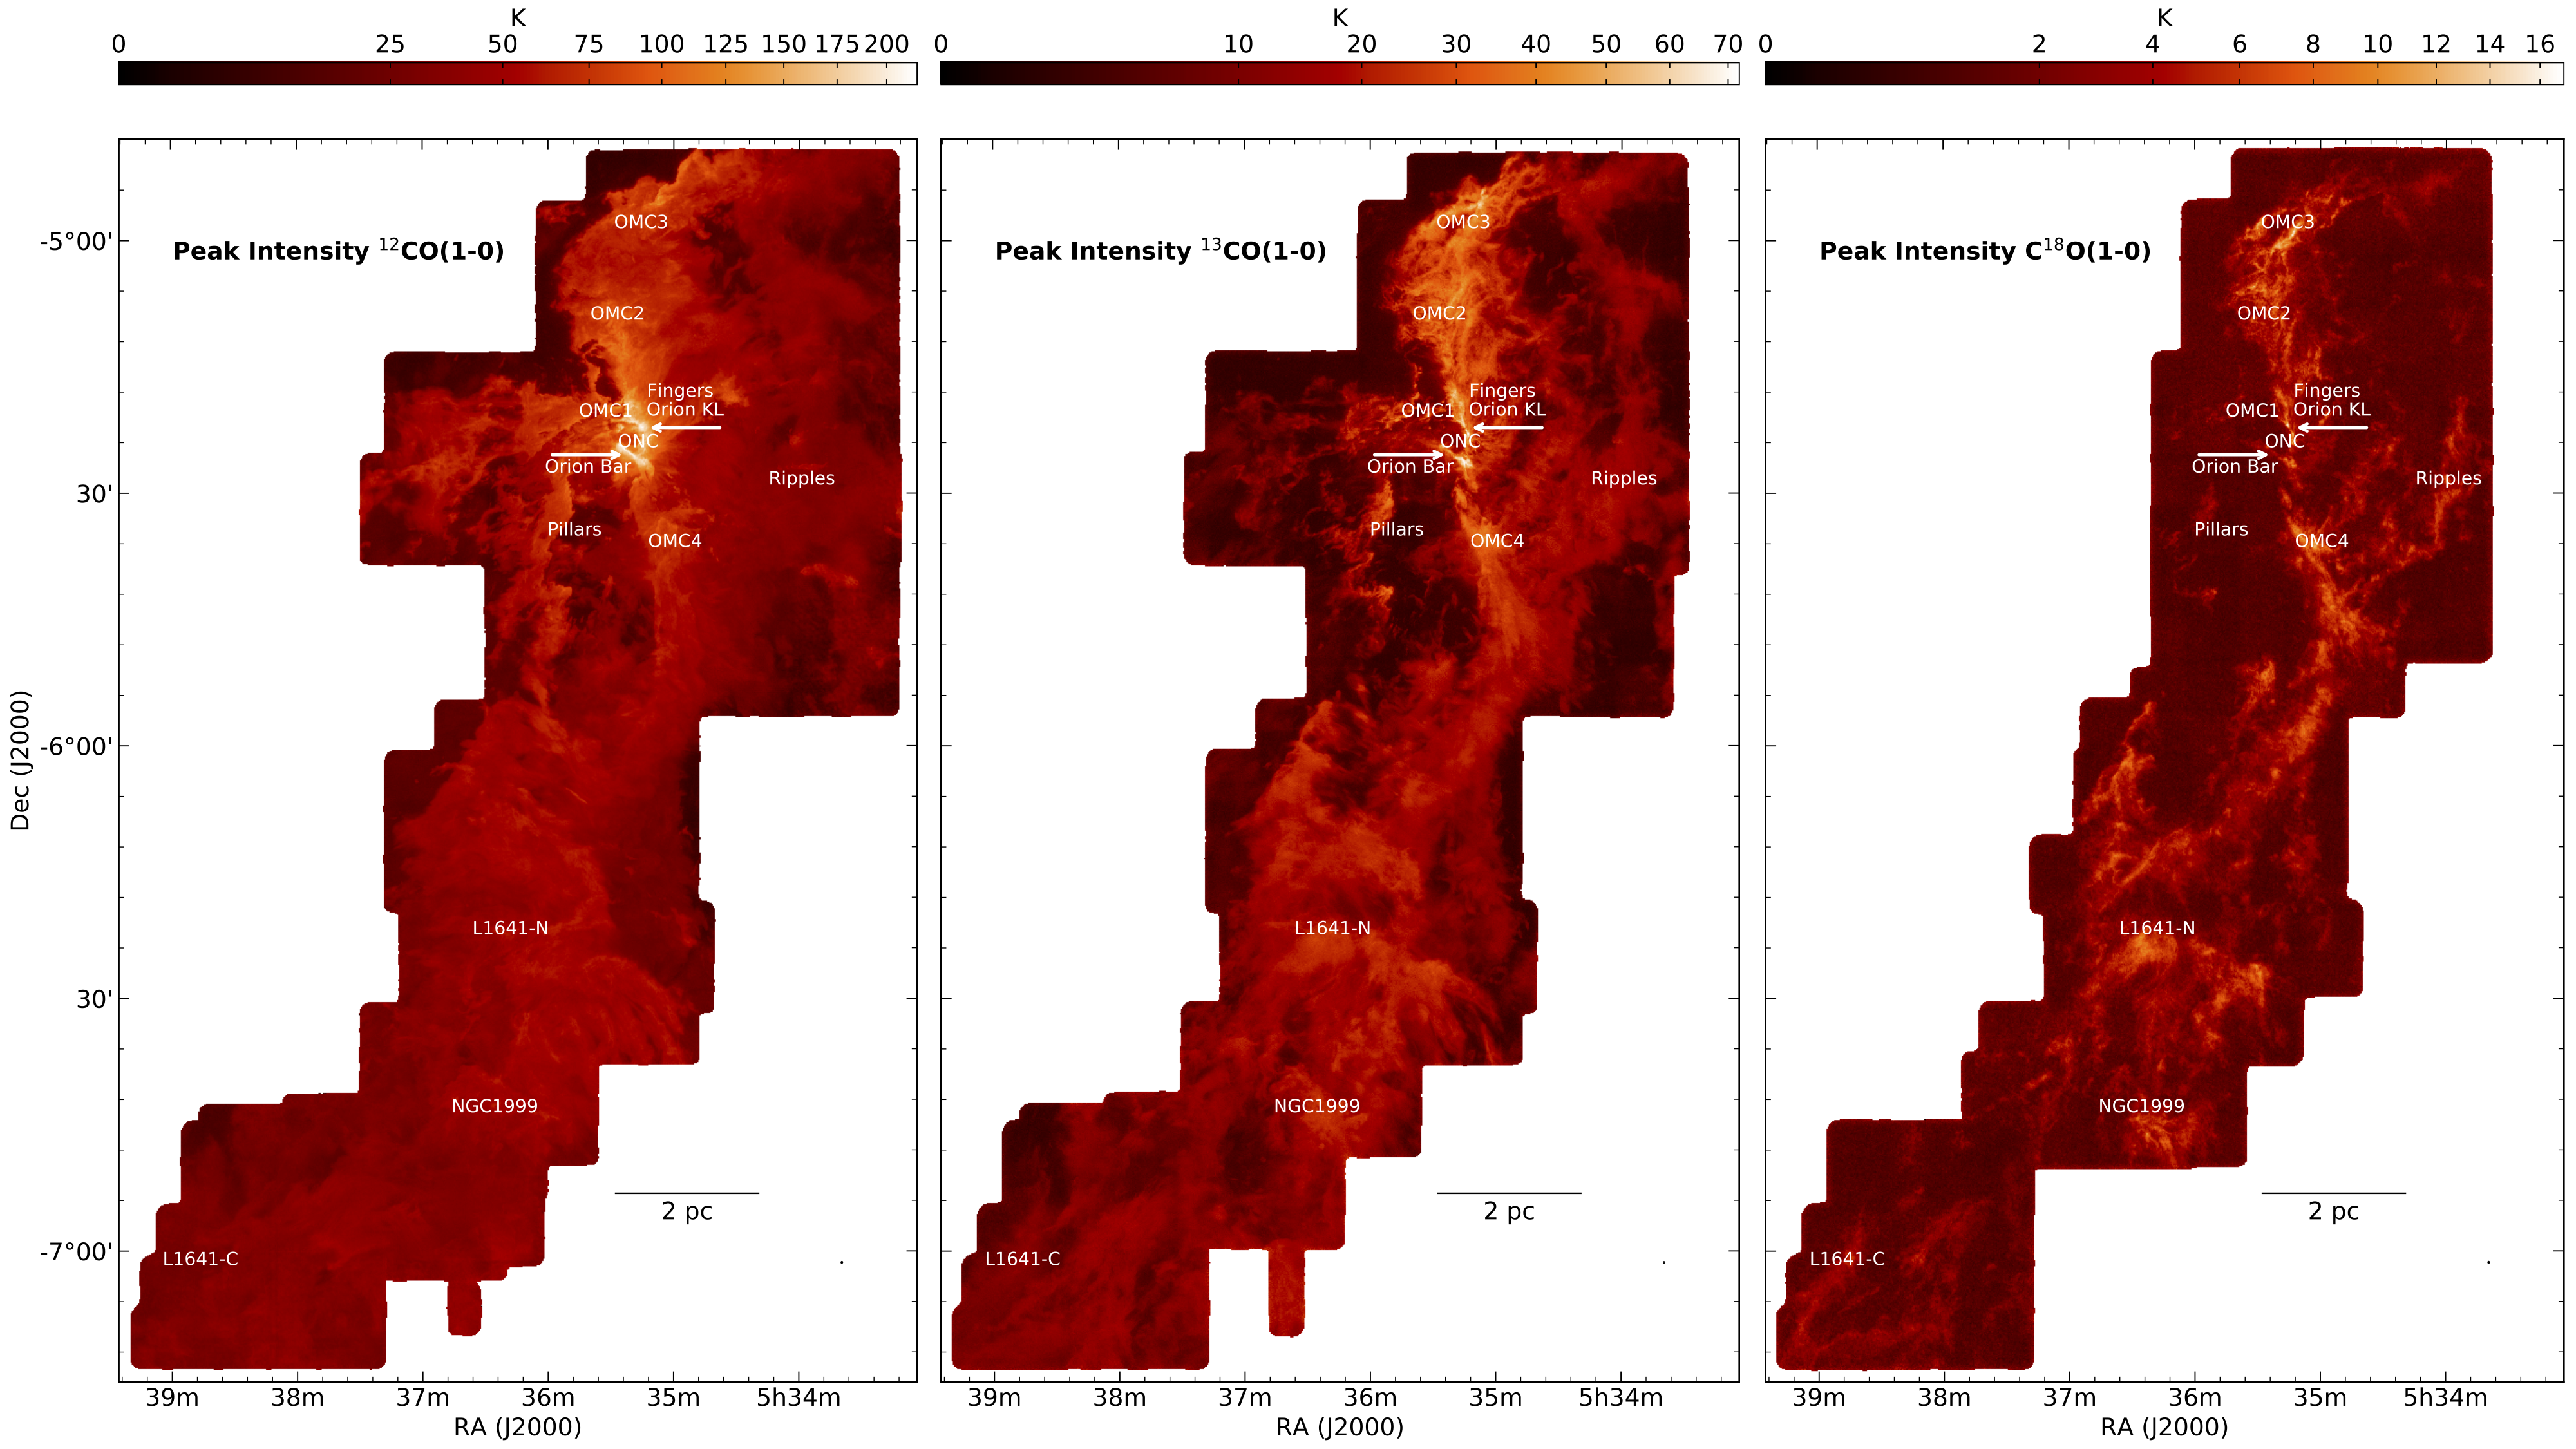
The Combined Array for Research in Millimeter Astronomy (CARMA)-Nobeyama Radio Observatory (NRO) Orion Survey is a high-resolution molecular-line survey of the Orion A giant molecular cloud (about 388 pc away), mapping the 12CO, 13CO, and C18O (J=1-0) lines. It is aimed at exploring star-forming structures with unprecedented detail. We combine data from the CARMA interferometer and the NRO-45m single-dish telescope in uv-space to recover structure from ~0.01 pc to ~10 pc scales, providing high-dynamic-range molecular line cubes for the massive star-forming cloud. The data products are available on Harvard Dataverse.
Team members (PI: Sargent, Anneila I.):
Sargent, Anneila I. ; Arce, Héctor G. ; Carpenter, John M. ; Nakamura, Fumitaka ; Shimajiri, Yoshito ; Takemura, Hideaki ; Isella, Andrea ; Ossenkopf-Okada, Volker ; Sánchez-Monge, Álvaro ; Bally, John ; Kong, Shuo ; Feddersen, Jesse R. ; Suri, Sümeyye ; Kauffmann, Jens ; Pillai, Thushara ; Pineda, Jaime E. ; Koda, Jin ; Lis, Dariusz C. ; Padoan, Paolo ; Klessen, Ralf ; Mairs, Steve ; Goodman, Alyssa ; Goldsmith, Paul ; McGehee, Peregrine ; Schilke, Peter ; Teuben, Peter J. ; Maureira, María José ; Hara, Chihomi ; Ginsburg, Adam ; Burkhart, Blakesley ; Smith, Rowan J. ; Schmiedeke, Anika ; Pineda, Jorge L. ; Ishii, Shun ; Sasaki, Kazushige ; Kawabe, Ryohei ; Urasawa, Yumiko ; Oyamada, Shuri ; Tanabe, Yoshihiro
The two data release papers:
- Kong et al. (2018), ApJS, 236, 25 (the original data paper).
- Kong et al. (2021), RNAAS, 5, 55 (including additional data to the south of L1641).
Peak intensity maps of the three lines:
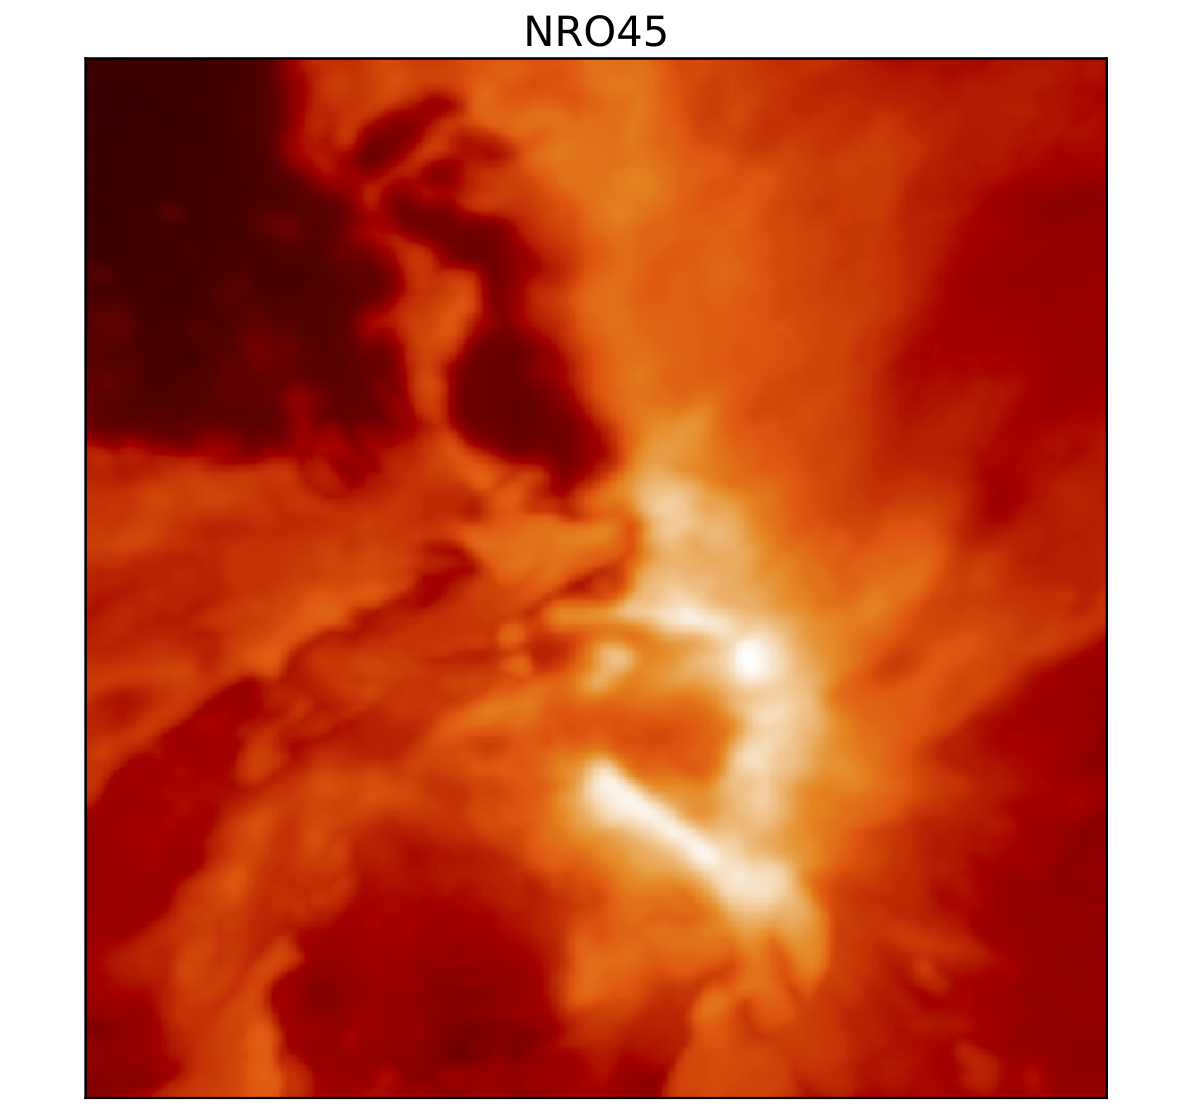
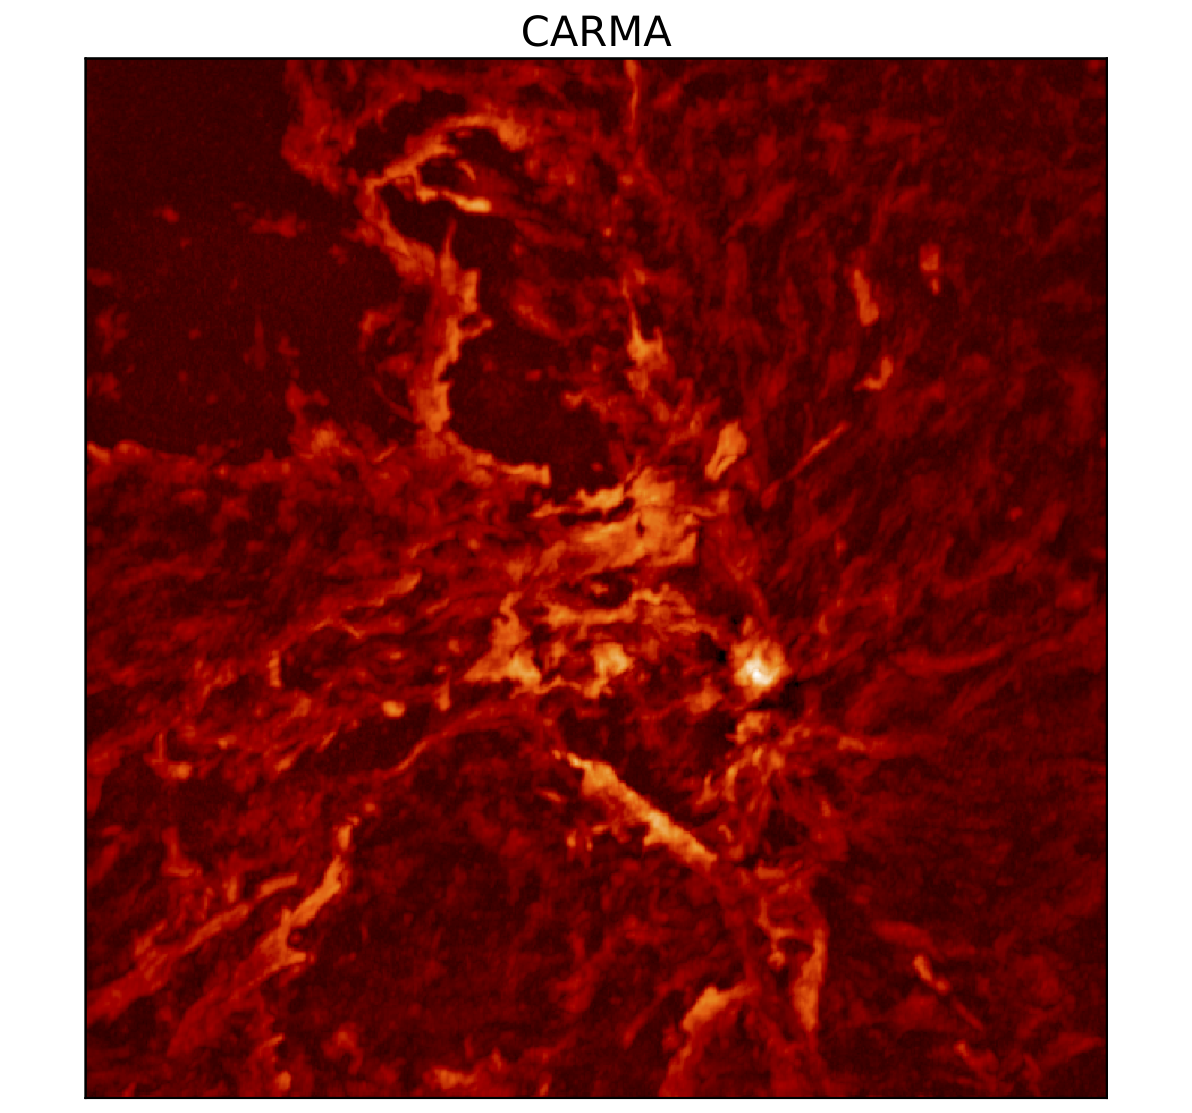
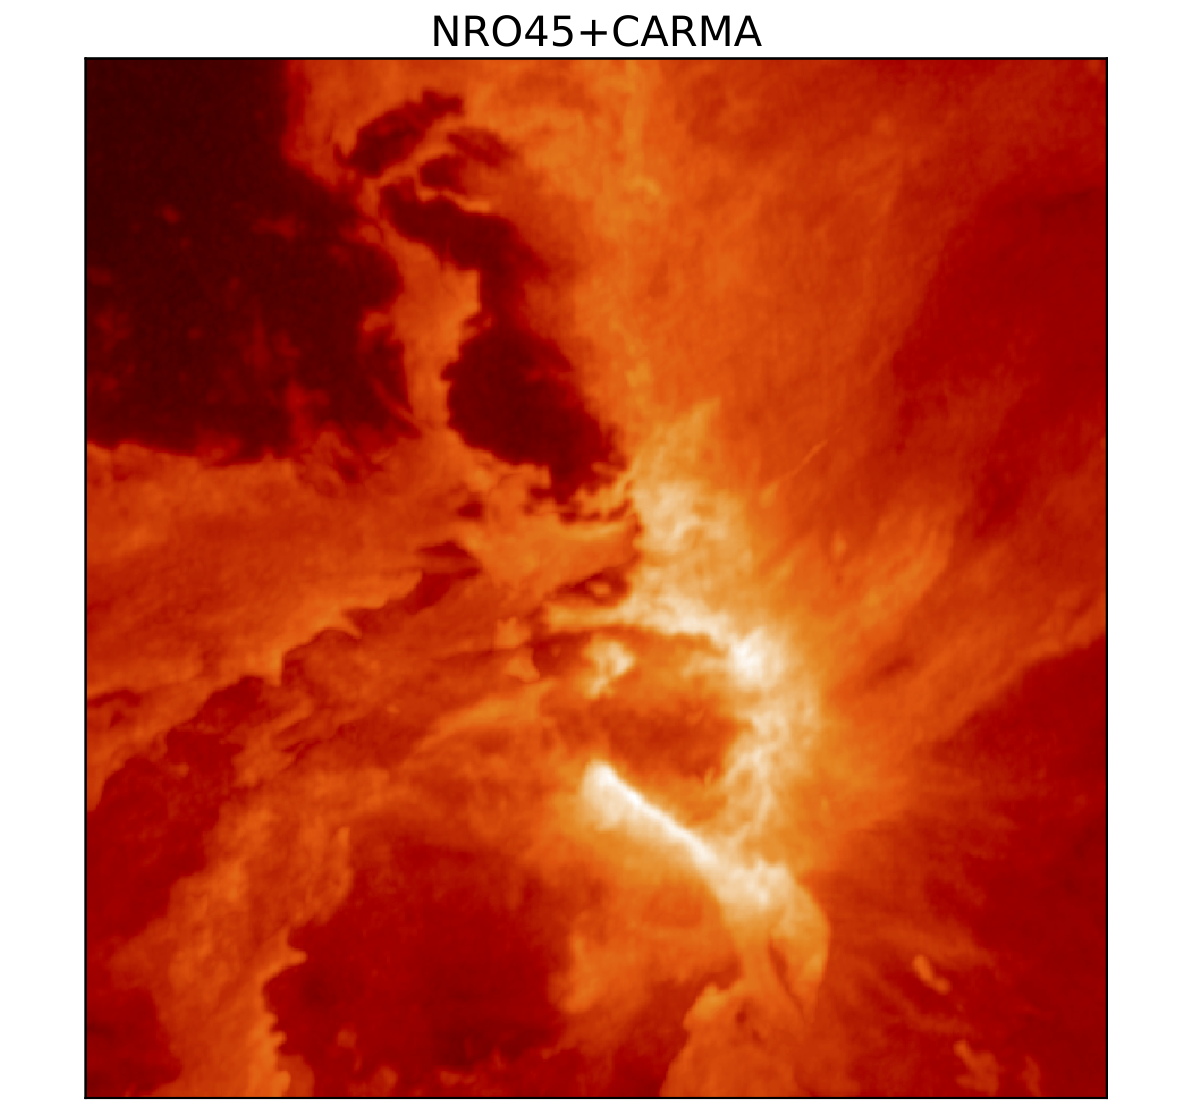
A brief description of the data combination (for more details, see the 2018 data paper or Koda et al. (2011), ApJS, 193, 19):
To combine the NRO45 data with the CARMA data, we first need to be certain that the flux scale of the two datasets match. We modify both datasets so that both maps are sensitive to the same range of spatial scales. By selecting visibilities in the overlapping uv-coverage and comparing the flux in the images obtained in the two data sets, we can determine a flux scale factor FCARMA/FNRO45. We obtained the ratio of intensities between the two dirty maps for each pixel with a signal-to-noise ratio greater than 20 within the region of interest. Plots of the distribution of the ratio for different regions and channels show that they all have a gaussian-like distribution with a mean value of about 1.6 for 12CO. We thus adopted a flux scale factor of 1.6 for 12CO(1-0). We multiply the flux scale factor to the NRO45 cube. Then, we de-convolve the NRO45 cube with the NRO45 beam, followed by de-mosaicking into the different CARMA mosaic pointings. For each pointing we obtain visibilities as if they were observed using a set of randomly generated baselines (following a gaussian distribution) that mimic the response of the NRO45. The number of points mostly depends on the value we assume for the NRO45 visibility integration time and the requirement that the sensitivity per pixel in uv-space for NRO45 visibilities be similar to that of the CARMA visibilities in the uv-range in which they overlap (3-6 kλ). We then merge all the modeled NRO45 visibility files together, followed by a joint de-convolution with the CARMA data.
The improvement of the combined image: